Imagine this scenario: Your Facebook Ads dashboard shows a 400% ROAS (Return on Ad Spend). You are celebrating. You scale the budget.
At the end of the month, you check your bank account and realize you have actually lost money.
How is this possible?
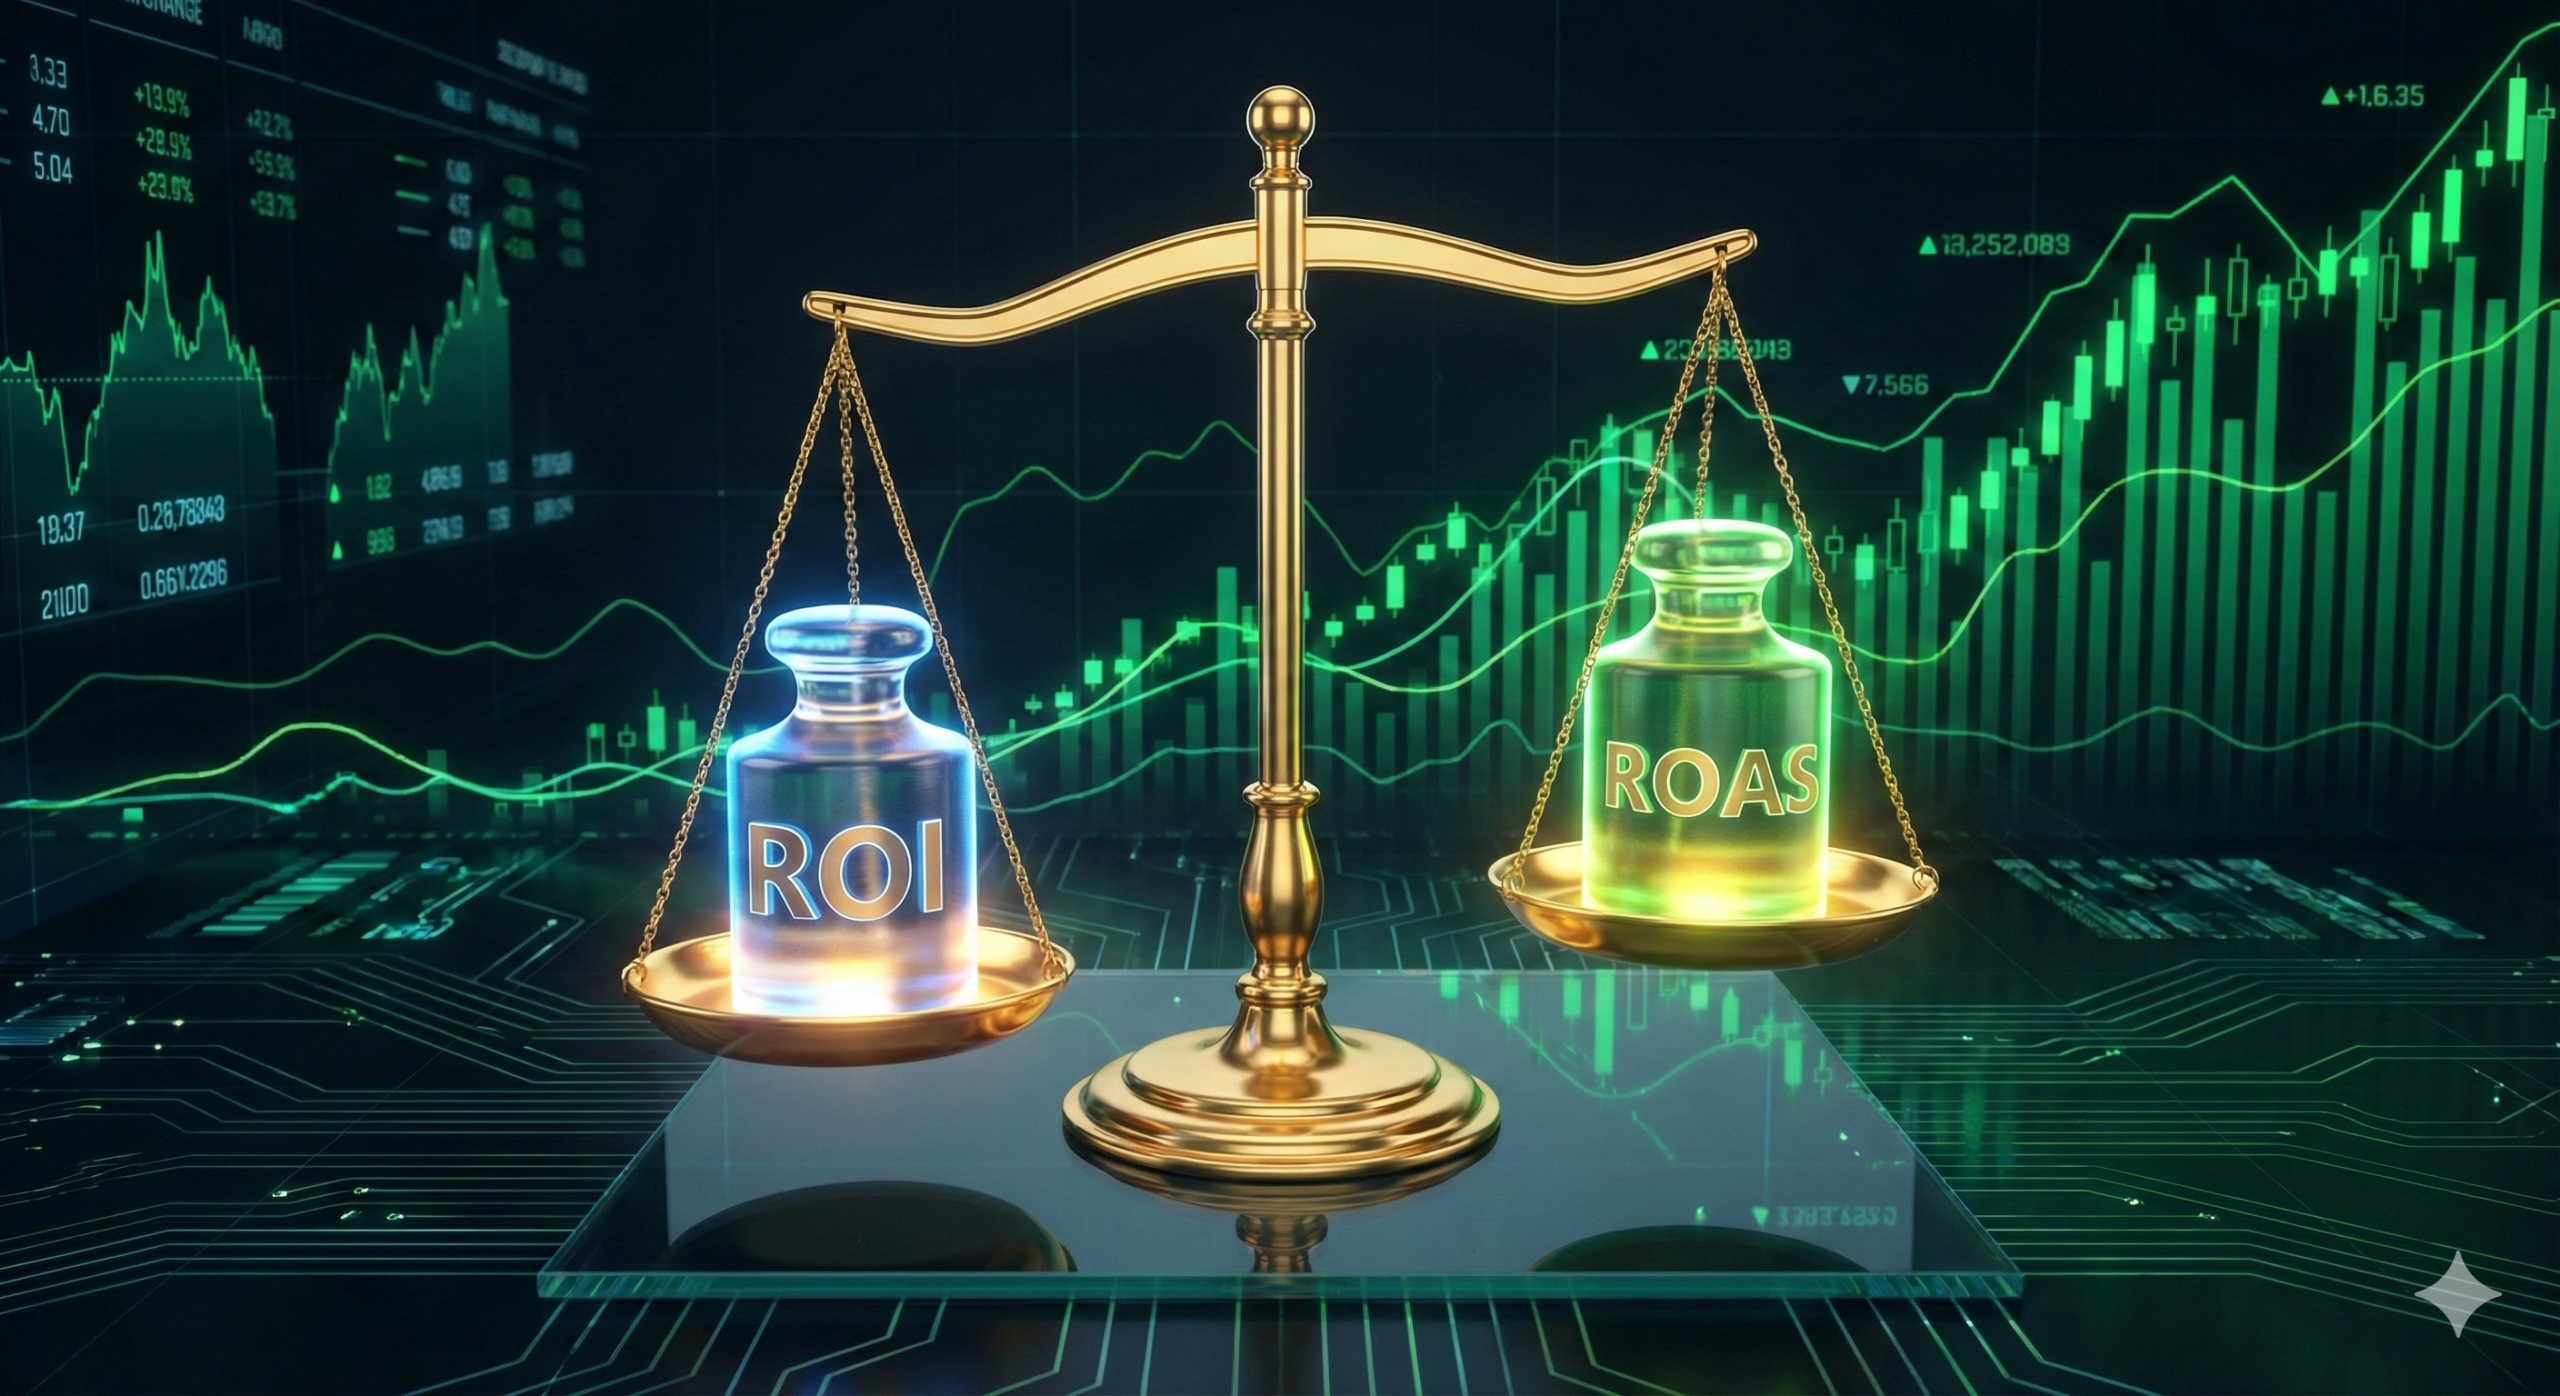
This is the “Profitability Trap,” and it happens when marketers confuse ROAS (Ad Efficiency) with ROI (Business Profitability). In 2025, with rising CPMs and tighter margins, knowing the difference isn’t just vocabulary—it is survival.
This guide explains exactly why a high ROAS can be misleading, provides 2025 industry benchmarks, and helps you calculate the numbers that actually matter.
The Core Difference: Efficiency vs. Profit
Let’s cut through the noise.
1. ROAS (Return on Ad Spend)
What it is: A measure of efficiency for a specific campaign. It tells you how much revenue you made for every dollar spent on ads.
- Formula:
Revenue from Ads / Cost of Ads - The Trap: ROAS ignores your other costs (Product costs, shipping, software, salaries).
📢 Check your campaign: Is your ad spend efficient? Test it now with our ROAS Calculator.
2. ROI (Return on Investment)
What it is: A measure of profitability for your entire business. It accounts for all expenses, not just the ads.
- Formula:
(Net Profit / Total Costs) * 100 - The Truth: ROI is the only metric that tells you if you can pay your rent.
📈 The Boss Metric: Don’t fool yourself with vanity metrics. Calculate your real Marketing ROI here.
The “Break-Even ROAS” Formula
To stop losing money, you need to find your “Break-Even Point.” This is the minimum ROAS you need just to cover your costs.
The 2025 Formula:
$$\text{Break-Even ROAS} = \frac{\text{Selling Price}}{\text{Selling Price} – \text{COGS}}$$
Example:
- You sell a pair of sneakers for $100.
- Your Cost of Goods (Production + Shipping) is $70.
- Your Margin is $30.
- Calculation: $100 / $30 = 3.33
Result: If your Facebook campaign has a ROAS of 3.0, you are losing money, even though the dashboard looks green. You need a ROAS of at least 3.33 just to break even.
🎯 Pro Tip: To calculate this accurately, you first need to know your exact acquisition costs. Use our CPA Calculator to find your limit.
2025 Benchmarks: What is a “Good” ROAS?
Based on the latest data for 2025, here is what successful companies are aiming for. Note that “good” depends entirely on your margins.
E-commerce Benchmarks
| Business Model | Good ROAS Target | Notes |
| Direct-to-Consumer (DTC) | 3:1 (300%) | Margins are usually tighter due to shipping/ads. |
| Marketplace Seller | 4:1 (400%) | Amazon fees eat into margins, requiring higher ROAS. |
| Luxury / Premium | 6:1 (600%) | High brand value allows for better returns. |
B2B & SaaS Benchmarks (The LTV Rule)
For Software as a Service (SaaS), ROAS is less important than the LTV:CAC Ratio.
- Healthy Ratio: 3:1 to 5:1.
- Warning: If your ratio is under 3:1, you are paying too much to acquire customers. If it’s over 5:1, you aren’t spending enough on growth.
💎 SaaS Growth: Are your customers staying long enough to be profitable? Calculate your LTV (Lifetime Value) here.
Platform Performance: Google vs. LinkedIn (2025 Data)
Where should you spend your budget this year? The data reveals a split in strategy:
- Google Ads: The king of volume.
- ROAS: Averaging 4-6x for e-commerce.
- Strength: High intent (people searching to buy).
- LinkedIn Ads: The king of B2B.
- ROAS: A massive 113% average ROI for B2B.
- Cost: Much higher CPC ($5.58+), but the lead quality is superior.
Strategy: Use Google to capture existing demand, but use LinkedIn if you need high-ticket B2B clients where a single sale covers the high ad costs.
Conclusion: Don’t Spend Blindly
In 2025, the era of “growth at all costs” is over.
- ROAS is for the Ad Manager optimization.
- ROI is for the Business Owner survival.
Before you increase your budget tomorrow, stop and do the math. Ensure your ROAS is above your Break-Even point.
Ready to audit your numbers? Start with the ROI Calculator to see the real picture.